Example data containing spatial coordinates for 1600 nodes, used to initialize spatially distributed population models and visualize simulation results.
Usage
data(nodes)Format
A data.frame with 1600 rows and 2 columns:
- x
Numeric vector of x-coordinates.
- y
Numeric vector of y-coordinates.
Examples
## For reproducibility, set the seed and limit threads to 1.
## To use all available threads, remove the set_num_threads() call.
set.seed(123)
set_num_threads(1)
## Create an 'SIR' model with 1600 nodes and initialize
## it to run over 4*365 days. Add one infected individual
## to the first node.
u0 <- u0_SIR()
u0$I[1] <- 1
tspan <- seq(from = 1, to = 4*365, by = 1)
model <- SIR(
u0 = u0,
tspan = tspan,
events = events_SIR(),
beta = 0.16,
gamma = 0.077
)
## Run the model to generate a single stochastic trajectory.
result <- run(model)
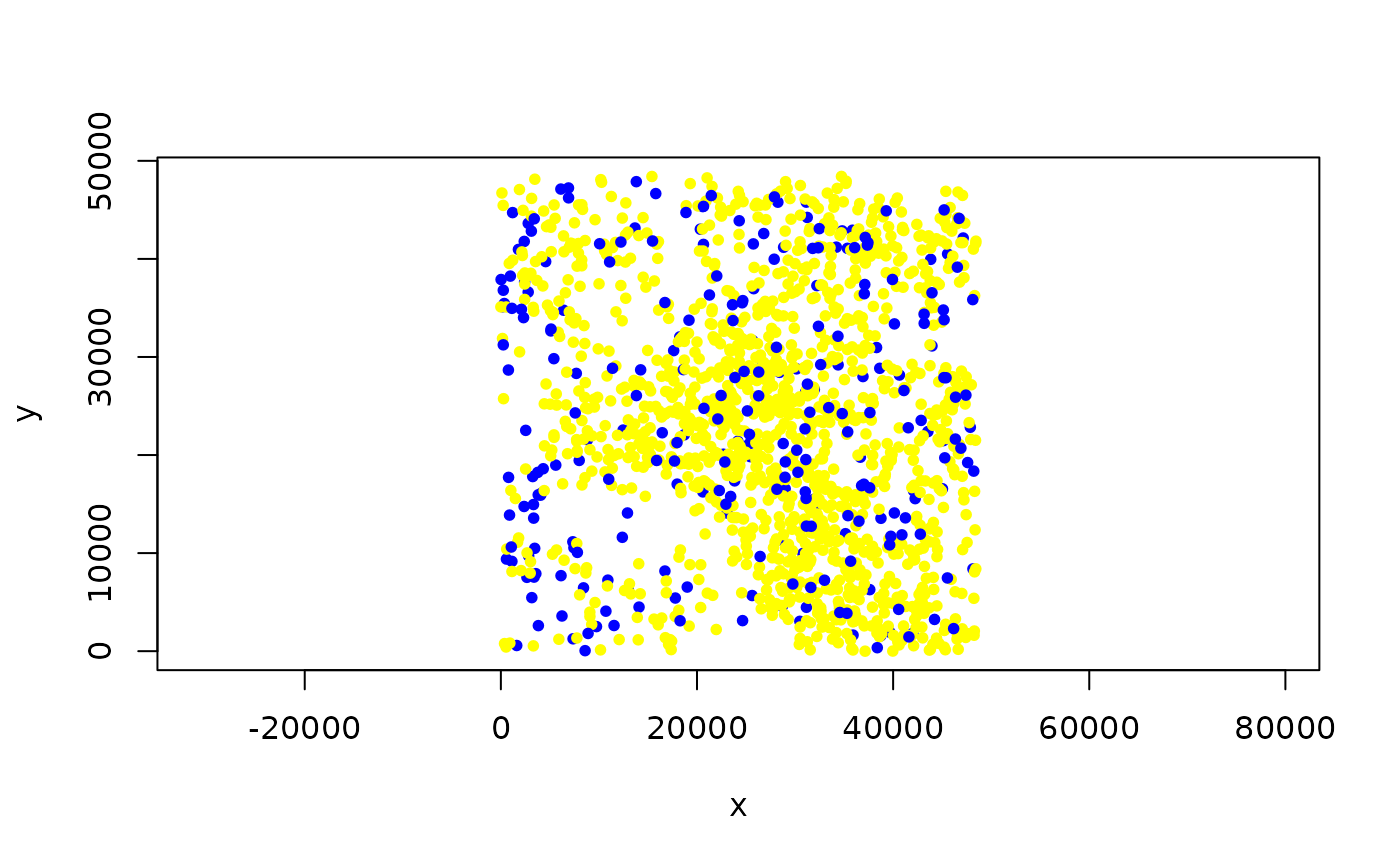
## Determine nodes with one or more infected individuals in the
## trajectory. Extract the 'I' compartment and check for any
## infected individuals in each node.
infected <- colSums(trajectory(result, ~ I, format = "matrix")) > 0
## Display infected nodes in 'blue' and non-infected nodes in 'yellow'.
data("nodes", package = "SimInf")
plot(
y ~ x,
nodes,
col = ifelse(infected, "blue", "yellow"),
pch = 20,
asp = 1
)