Create an SIS model to be used by the simulation framework.
Arguments
- u0
A
data.framewith the initial state in each node, i.e., the number of individuals in each compartment in each node when the simulation starts (see ‘Details’). The parameteru0can also be an object that can be coerced to adata.frame, e.g., a named numeric vector will be coerced to a one rowdata.frame.- tspan
A vector (length >= 1) of increasing time points where the state of each node is to be returned. Can be either an
integeror aDatevector. ADatevector is coerced to a numeric vector as days, wheretspan[1]becomes the day of the year of the first year oftspan. The dates are added as names to the numeric vector.- events
a
data.framewith the scheduled events, seeSimInf_model.- beta
A numeric vector with the transmission rate from susceptible to infected. Each node can have a different beta value. The vector must have length 1 or
nrow(u0). If the vector has length 1 but the model contains more nodes, the beta value is repeated for all nodes.- gamma
A numeric vector with the recovery rate from infected to recovered. Each node can have a different gamma value. The vector must have length 1 or
nrow(u0). If the vector has length 1 but the model contains more nodes, the gamma value is repeated for all nodes.
Value
A SimInf_model of class SIS
Details
The SIS model is a commonly used compartmental model for infectious diseases where individuals do not gain permanent immunity after recovery. Instead, they return to the susceptible state. It divides the population into two states: Susceptible and Infected.
The model is defined by two state transitions: $$S \stackrel{\beta S I / N}{\longrightarrow} I$$ $$I \stackrel{\gamma I}{\longrightarrow} S$$
where \(\beta\) is the transmission rate, \(\gamma\) is the recovery rate, and \(N = S + I\) is the total population size in each node. Here, \(S\) and \(I\) represent the number of susceptible and infected individuals in that specific node.
The argument u0 must be a data.frame with one row for
each node with the following columns:
- S
The number of susceptible individuals in each node
- I
The number of infected individuals in each node
Examples
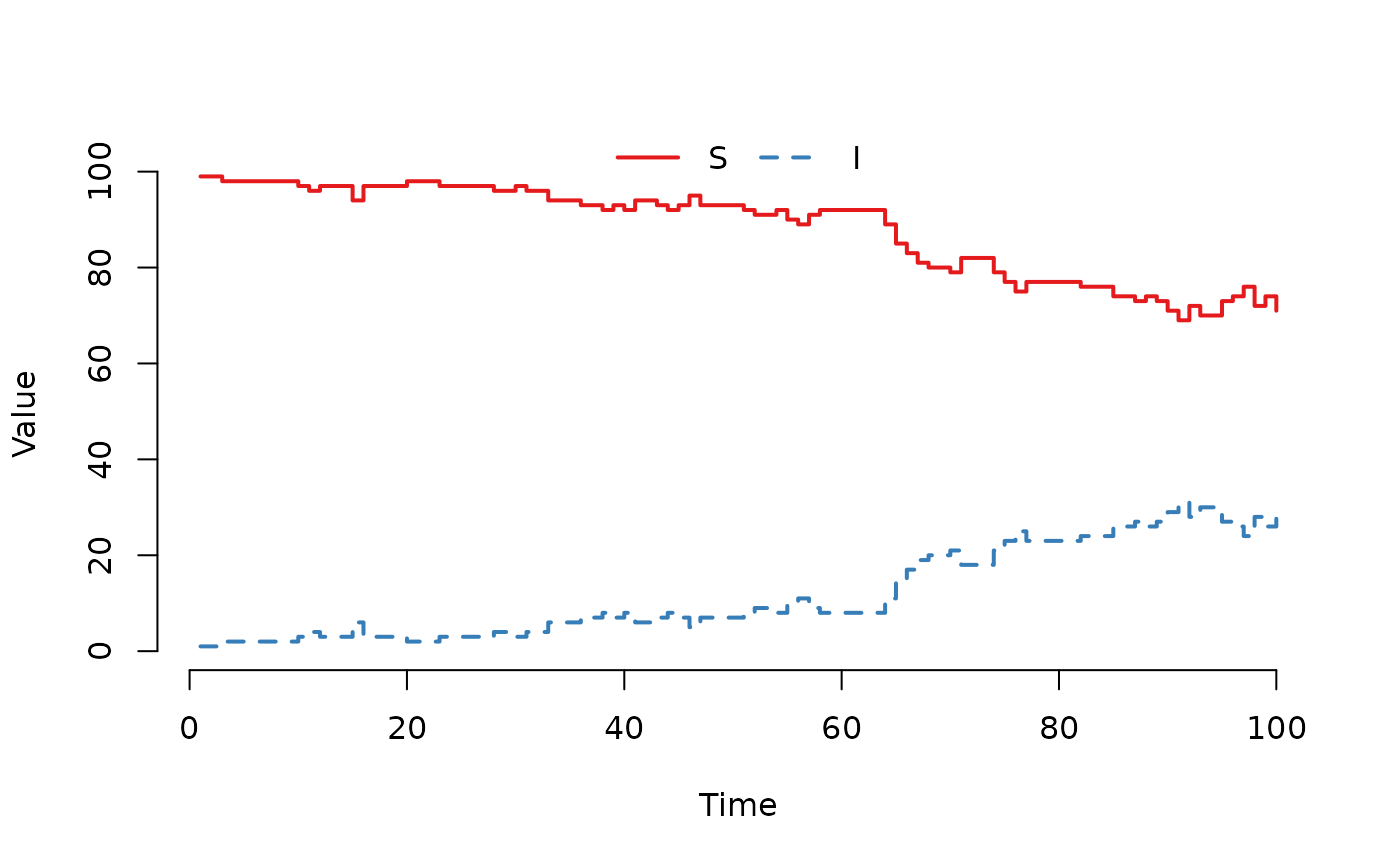
## Create an SIS model object.
model <- SIS(u0 = data.frame(S = 99, I = 1),
             tspan = 1:100,
             beta = 0.16,
             gamma = 0.077)

## Run the SIS model and plot the result.
set.seed(22)
result <- run(model)
plot(result)